Chapter18
US Long-Term Economic Growth 

 Index
 I. Analyzing Economic Growth

 II. Determinates of Economic Growth

 III. Growth Data

 IV. Will U.S. Stay On Top?

 V. Job Outlook Based On Education 

 VI. Is Growth a U.S A Problem

 VII. Thoughts from the Internet

 VIII. Current Economic Wellbeing 1p

 Macro Review 14-18

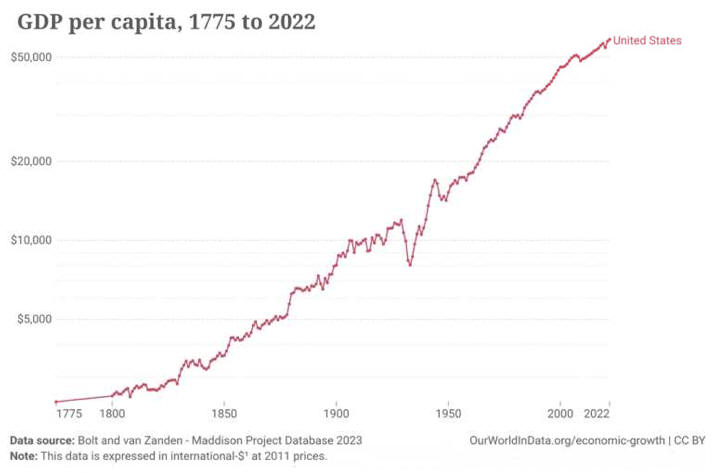
Very Consistent US Growth

Return to Economics Internet Library

Lecture Notes
1-page printable lecture notes

I. Analyzing Economic Growth


          D. View Bradford Delong's( USC Berkley) dynamic
              presentation of  GDP growth per capita since 1900.

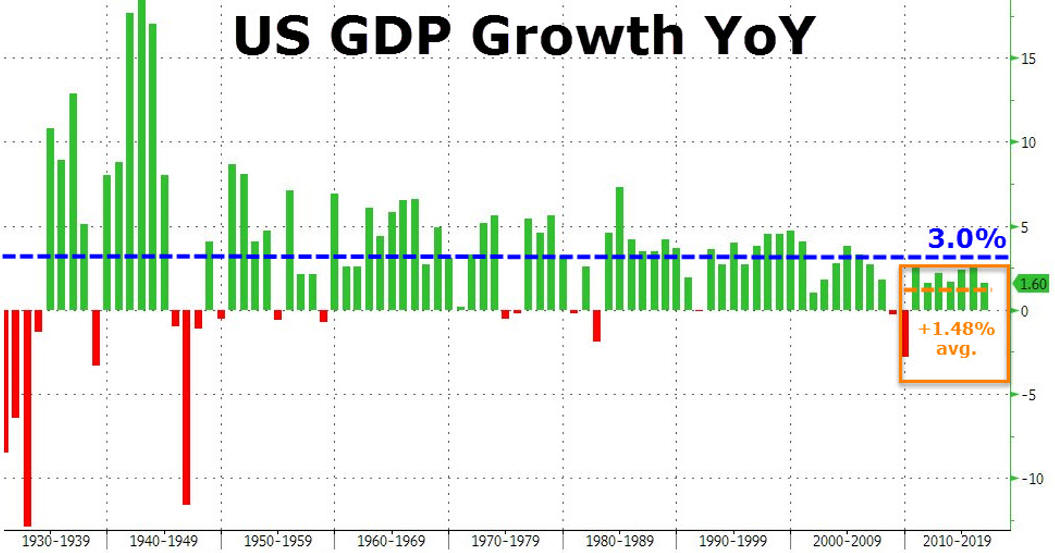
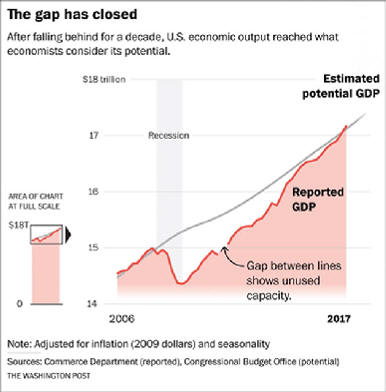
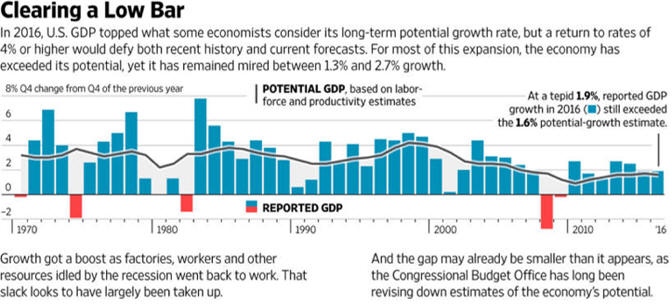
         E. Recently Economic Growth Slowed 


  F. Readings/Videos
 
   1. U S Could Use A New Economic Strategy 3/1/16

     2. Crisis, and  Possible Futures, of All Things Euro 12/ 6/1

     3. Bob Allen: Global Economic History --4 Clips

     4. Top 2019 charts clarify economic priorities for 2020


Political Economy Growth Stuff
US Invests Much

Who Is Winning the AI Race

U.S. and Friends Lead
the R&D Race

The Richman FED Looks to the Future

III. Growth Data

A. Business Cycle data since 1854

B. The Greatest Century That Ever Was: 25 Miraculous Trends of the Past 100 Years

C. The First Measured Century: An Illustrated Guide to Trends in America, 1900-2000
     

D. Time Series Data

But Who Gets What Continues to be Discussed!

For a Very Long Time


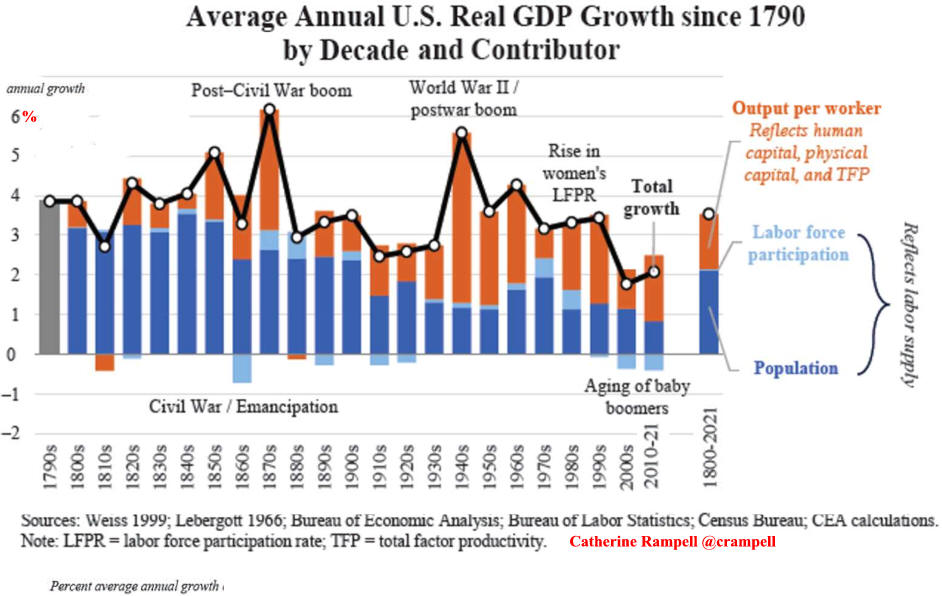
Consistent Growth
Does Not Mean Constant Growth


But, US Working Age Adults
 Contribute Less


Foreign Investment
 in U.S. Looks Good


U.S Leads the West in Net Investment
Plus US Has Unmeasured Military R&D


IV. Will U.S. Stay On Top?

Before 1990 Some Predicted Russia
Would Passing U.S.


USSR Growth History


In the 1990's it was the European Union

"Although customs duties disappeared in 1968, is not flowing freely across EU borders. The main obstacles are differences in national regulations. The Single European Act of 1986 launches a vast six-year program to sort these out. The Act also gives the European Parliament more say and strengthens EU powers in environmental protection".  

Note how Europe's high growth rate of the 1990's slowed. In the 2010's Europe slumped again and US growth rebounded in a similar fashion as it has in past balance sheet recession.


For a more in depth analysis see koos-balance sheet recession
See
5 Reasons Germany Isn't  Suffering in the 21st Century

21st Century Europe Sufferer

Source


In the 21st Century
Some Think China

V. The Job Outlook Based On Education and Geography


Europe’s brain drain is getting worse -
so some countries are scrapping income tax for young people
(CNBC)

Europe’s brain drain is getting worse -
so some countries are scrapping income tax for young people
(CNBC)


US Economic Growth Quick Studies
Preface: Western Civilization Economic History

The Business Cycle
US Recessions Chronology
Most Severe US Recessions
The Great Recession 3 p
Great Recession: Historical Perspective
Post WW 2 US Economic Adjustments
Post WW2 International Economic Adjustment
Global Economic Growth and the Rise of Populism
History of Stock Bubbles

EXPECT CHANGE

Urban Job Growth

Composition of Average Real GDP by Sector: Metro and Nonmetro Counties Growth Potential U.S. Metro U.S. Nonmetro
Private Goods-Producing

Low

17.9% 32.4%
Private Service-Providing

High

70.1% 51.9%
Government and Government Enterprises Slower 11.9% 15.7%
      Government and
Government Enterprises
employment Nonmetro is High


        4. The lost decade shows slow growth for a while. 
            Interesting comments. 08/20/10

        5. Economic Stagnation fro L. Summers 80 min vide

        6. New Normal The Prospects For Long-Term Growth in The US

The Good: Third Industrial Revolution Investments are less cost.
The Bad: Third Industrial Revolution Production Requires Fewer Unskilled Workers..

Some Think Slow Growth is a Problem


Others Do Not

One Possible Answer to Higher Growth

    VII. Thoughts from the Internet
           A.
How the Government Dealt With Past Recessions from the New York Times  
           B
. Industrial Revolution and the Standard of Living 
                by Clark Nardinelli
          C.
The First Measured Century  
               Ben Wattenberg's classic is a must for those interested
               in the economic history of the 20th century.
     D.
Escape from Hunger and Premature Death, 1700-2100
       
by Robert William Fogel. Cambridge University Press, 2004.
      E.
annual report on income, poverty and health insurance  Census Bureau’s 2008 
      F.
50-Reasons We are Living Through the Greatest Period
      G. The Next Economic Disaster
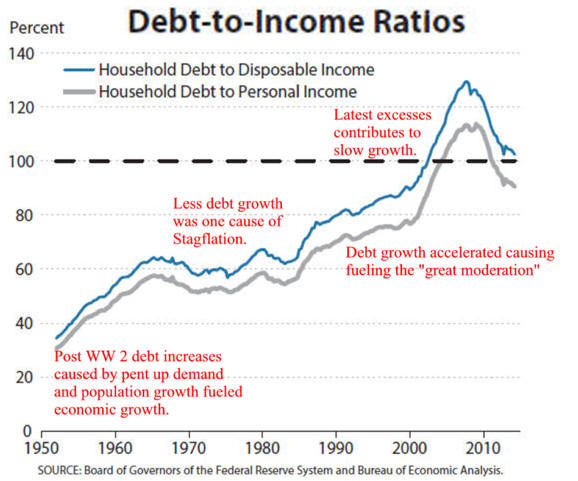
video blames high private debt for slow growth
      H.
Cycles: Some empirical issues show that long term can be a long time.
     
 I. Trade Ruler: is a digital game using trade to increase growth.
      J. The World Is Flat
and growth prospects are limited.
       
1.
Tradable Jobs 8/1/11 from http://www.economicpopulist.org/
       
    "... if the 27.3 million jobs added from this time period, 97.7% of them
                  were non-tradable. What do the authors mean by tradable jobs
                  Jobs that can be offshore outsourced." ...  "As an example, health
                  care must be domestically sourced because sick people are here.
                  Computer architecture, on the other hand, can be offshore outsourced
                  and the results moved around the globe to a manufacturing center."
       
2. New jobs created are not in Tradable Goods that the world wants


Last Chapter 


Chapter 19 Introduction to Microeconomics
 

Chapter 18 Class Discussion Questions Table of Contents
Chapter 18 Homework Questions Economics Free Stuff

Not Consumers

Is There Too Much Information for an Internet World?


The Home Size/ Bathroom Index Indicates No


Current Data
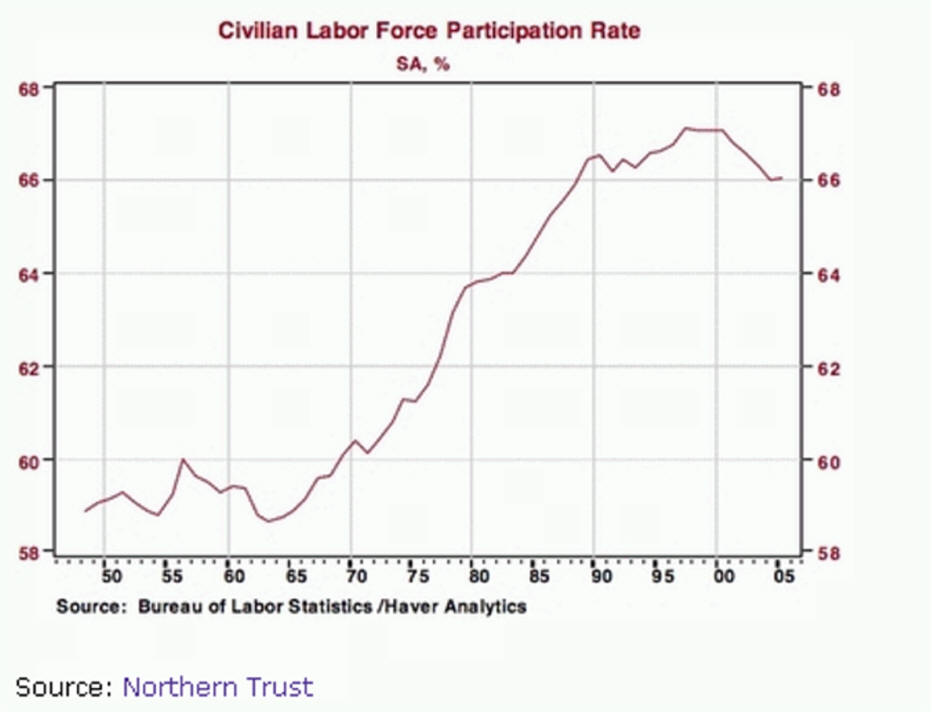
Civilian Labor Force Participation Rate
(%)

Median Income Grew by 14% Then Dropped Back to Only 5.9%
Two Big Drops Over 40 Years Didn't Help


Politicians and Media Like This Quick But Low Growth Estimate. Since 1965 Fringe Benefits and Household Composition Have Affected Income growth. Measuring Middle Class Wellbeing Requires Adjustments for Appropriate Inflation Measure, Fringe Benefits and Household Type.     


Federal Reserve Middle Class Wellbeing Up 44% to 62%   Source

FED'S 44% TO 62% Increase Better Than 5.9% BUT
 Much is Health Care and Entitlements and
 Popular Media Polarizes Many See Economic Wellbeing


GDP of countries 1970-2020 3 min Video   Source DataViz


Read full article


Low Investment is Not the Problem!

Retail Prices and the Time Cost of Household Appliances:
1959 vs. 1973 vs. 2013
source

Household Appliances Cost Per Hour Worked Down 85%  source 
 

11 Household
Appliances
Price
1959
Hours Worked
@$2.09
Price
1973
Hours Worked @$3.95 Price
2016
Hours Worked
@20.13
Washing Machine $210 101 $285 72 $480 24
Refrigerator $350 168 $370 94 $500 25
Coffee Maker $23 11 $37 9 $30 1.5
Vacuum Cleaner $95 46 $90 23 $140 7
Color TV $267 128 $400 101 $250 12
Totals $945 454 1182 299 $1,400 69.5
Percent Decrease     (454 -299)  ÷ 454 =  34% (299 - 69.5) ÷ 299 = 77%
Numbers Rounded    Editor's Note: Since 1957 the cost measured in hours worked has dropped 85%

,See Life of American Workers in 1915 from BLS  is quite deplorable and Trans Pacific Partnership Currency Manipulation Trade and Jobs shows a large loss of jobs with not attempt to quantify their value added (wage).

Editor's Note:

In spite of this data the many people think average earners are worse off than 50 years ago.
No one notices growth but it continues decade after decade.

U.S. Has Low Mobility and High Inequality
But Economic Wellbeing
Is High

businessweek.com/articles/2013-12-05/