Fake News From Economic Statistics
Communication from
media, economist, politicians
and professionals providing Inadequate, bias information concerned with
personal ideology rather than appropriate information and theories.

See Understanding Fake News  Return to Active Fake News Warnings   1/11/24        Please Share!
 

Misuse of Consumer Price Index- CPI

Wage Growth < Productivity Growth

Income Inequality Increasing

Rich Have All the Wealth

 Wage Stagnation   

 Federal Debt  


Preface:
Who is responsible for educating the public in relation to Important Economic Questions? 5/26/22

1. Misuse of the Consumer Price Index- CPI

CPI Inflation Measure is Designed to be Quick.
It is Not Designed for Long-run Analysis.
 Media Doesn't Understand this and Economists follow their Prejudice.
This misuse is Fake News.

And here’s what Average Hourly Earnings look like
when you deflate them by two often used measures.
CPI, real wages are 4% below their 1973
while PCE increased 18%.
 

 Exploring Misuse of CPI Index (Red)  
 

The CPI-U-RS allowing changing of buying habits was
15 percent points higher
than the
CPI index.

 The Federal Reserve considers the  PCE A Index (Green)
the best for measuring the affects of inflation because
consumers
change buying habits, especial now with online retailing. 
The PCE A income index was 29 percentage points higher
 than the CPI index

  From a paper by Bruce Sacerdote


But outperformance of real wages using the PCE over PCI is a very old story.
tlranalytics
acknowledges the problem but doesn't organize to solve it.
No one will solve it. They are making too much money because of the poor measurements applied to political issues.

Additional Analysis


2. Wage Growth is < Productivity Growth

Fake News

The Real Story

Source

Source Article

3. Income Inequality is Increasing

Income inequality in the United States: it’s flatter than you probably realize (Phillip W. Magness)  Magness reviews distortions introduced in Piketty-Saez analyses by incorrect treatment of U.S. tax laws in their calculations.  Magness has constructed what he says is a corrected income distribution curve for the U.S.  Econintersect:  Of course, none of this impacts wealth distribution which also has gone through extreme swings.

When you take out the top 1/10th of 1 percent. not much has changed.
Much anxiety results.
Source


 7-1 Additional Analysis

 B. Price Index used dramatically
   1. CPI Adjusted Index-Chart is Red
     a) Adjusts for seasonable differences
     b) Under estimates income change source
     c) Used by people wanting quickly updated data
     d)
Used to grow support for government programs
  2. CPI-U-RS Adjusted-Chart is Blue   
     a) Measures urban purchases which is more realistic
     b) It does not incorporate all possible data on past inflation. 
     c) For example, no attempt made to reflect any new information
       on trends in the safety or comfort of air travel for which there

       is no corresponding methodological change in the CPI-U. bls.gov
  3. PCE A Index-Green Chart reflects "consumer substitution" is difficult
    to implement in real time.
    a) Measures buying of economic shoppers 
    b) When oranges are really expensive substitute bananas or grapefruit.
     1. BLS examples
     2.
PI-PCE-Comparison
     3. CPI A is like always shopping at the local convenience stores
     4. PCE is like shopping at Wal-Mart, local sales and
       Internet for the now  popular as is an i-phone.
 4.
Problems With Economic Measurements Over Time 5 min video

Because CPI A is The graph shows high nominal wages
can be adjusted by
unprofessional users to look

a lot lowered by using the CPI
and a lower by
CPI-U-RS

Changing buying habits by price helped 15
points with CPI-U-RS and 29 points with PCE A.


Median income of the middle class in 2016 is about the same as in 2000


This PEW Data took the middle ground and by giving the index, was better than most. It is almost fake news and mentioning  the possibility of income growth with COI Adjusted Index would have made a better representation of reality.

C. Workers receive more than income: compensation compared to productivity determines
    degree of stagnation.

a. Consumer Price Index is used by many to adjust income changes over-time for inflation.
    CPI is for quick, timely use, not for time series analysis.

b. Total Compensation Index-CPI adds fringe benefits to represent value received for labor.

c. TC using Persona Consumption Expenditures Price Index measure goods and services
    targeted toward consumers and is a better guide to consumer purchases.

d. TC Implicit Price Deflator adjusting PCE for changes in consumer behavior in response
     to price changes and change in taste. Source Heritage Foundation with data from US
     government agencies.

e. Measuring Worth explores adjusting trend data for inflation

Worker Compensation has Increased Even More

Productivity and Compensation Growing Together

Share of adults living in middle-income households is unchanged since 2011

Consumer Population Survey Annual Social and Economic Supplements could be CPI

For assistance, please contact the Census Call Center at 1-800-923-8282 (toll free) or visit ask.census.gov for further information.


7-2 Additional Analysis

Where Has All the Income Gone?

Proper Measurements Paints
 a Better Picture

Source
Wellbeing Proper
Measurement Paints a Better Picture

Politicians and Media use quickly available and lowest income growth estimate. Since 1965 fringe benefits and household composition affected income growth. Measuring Middle Class Wellbeing Requires Adjustments for these and the use of the most appropriate inflation measure.  

See Economic Normality 1945-2015 and Americans- Forget How Good They Have It  

Source  See
Problems With Economic Measurements Over Time. 5 min video


4. Rich Have All the Wealth

 The major source of lower income Cohort,
Social Security and Medicare and Medicaid
are not considered wealth accumulation.

See 7-3 Additional Analysis

 
Editor's Note: About 20 years ago I read where people concerned over the budget wanted to tie government salaries and SS to a more realistic measure of inflation and I was not surprised when government employees making the decision took about ten years to make the change.

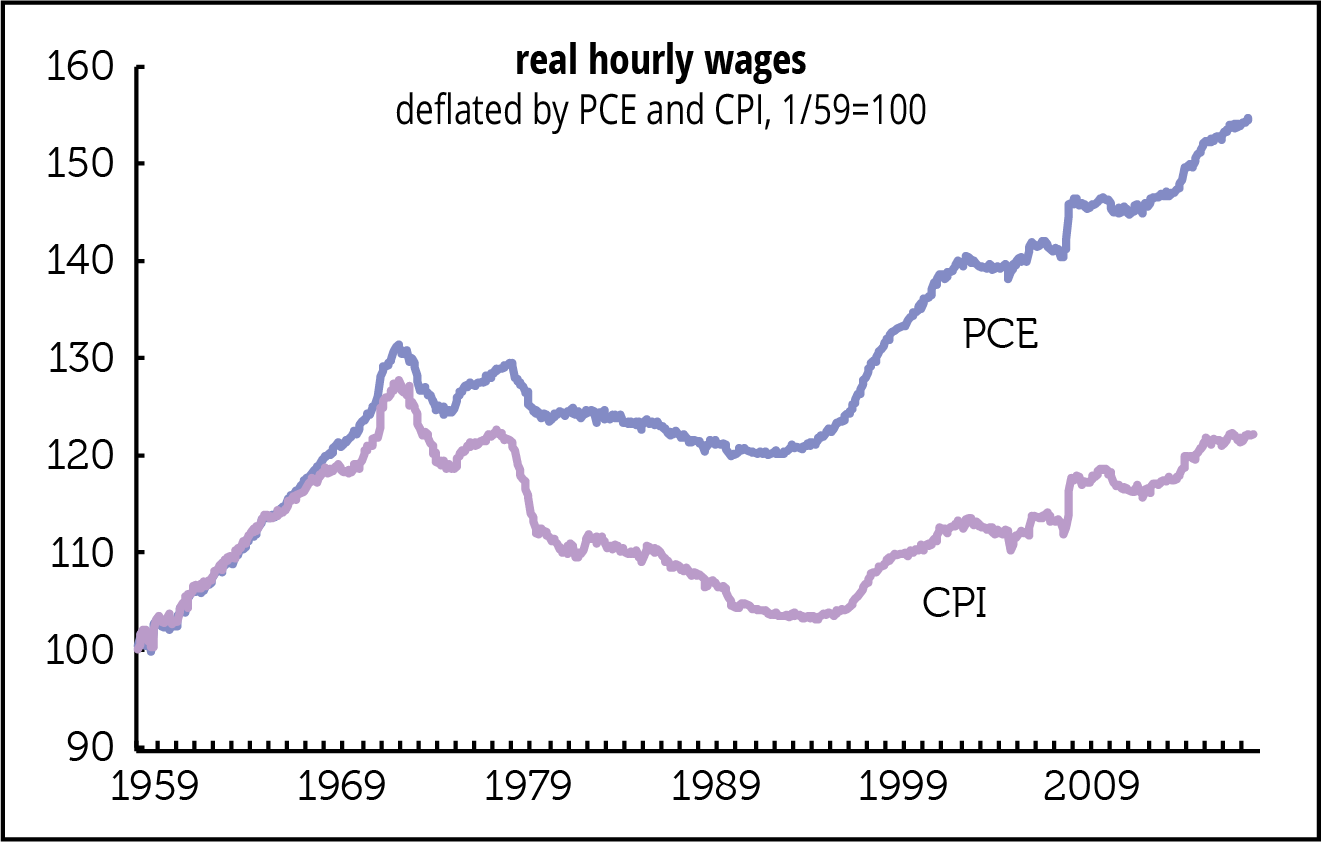
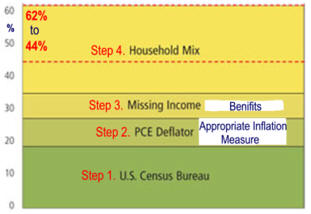
SS still uses a  CPI Index to adjust benefits which gives recipients a bonus. "...many economists, ...conclude that the CPI overstates inflation." "... only some of the upward bias in the CPI have been eliminated."  

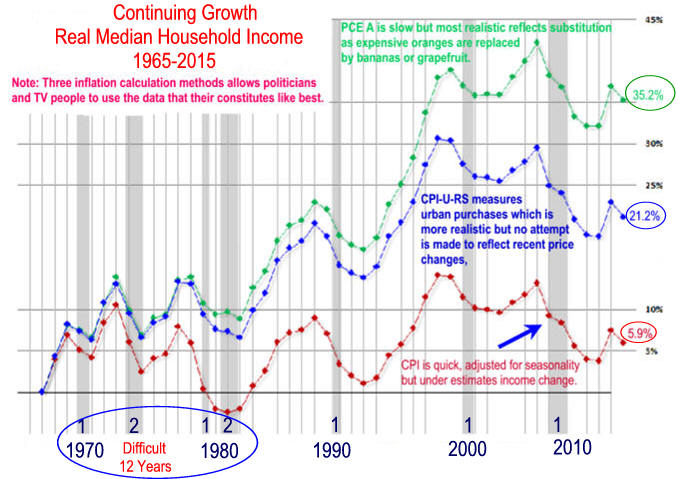
"The Chained C-CPI-U is another step toward eliminating the substitution bias remaining in the CPI-U and CPI-W. Source
As of 2005 the BLS reports "The C-CPI-U to our knowledge currently is not used in any federal legislation
as an adjustment mechanism."   
 

Recently when the IRS came under fire for going after conservative non profits
 I thought the reason was they thought liberal would want more government, more employees, more promotions ...


The Good Old Days Were Expensive

1964 TV's Were
Really Big and Really Expensive
and Everyone had a Sunburn


Today's TV Screens are Bigger, Set Is Smaller With a Much Better Picture
and Look at All the Extra Stuff You Get Today!
<0b>

the-magic-of-the-global-marketplace-and-the-miracle-of-global-manufacturing-christmas-1964-vs-today/