|
Crime and Drugs in America Return to textbooksfree.org Updated 2/20/18 Please link to, use to educate and |
||
|
|
Index
|
|
|
Crime and Drugs in America Return to textbooksfree.org Updated 2/20/18 Please link to, use to educate and |
||
|
|
Index
|
|
|
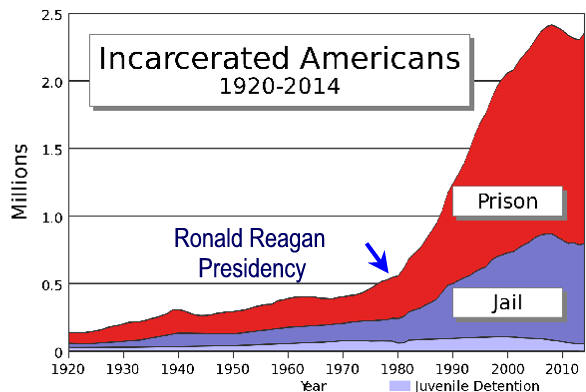
We Put a Lot of People in Jail
|
||||||
|
|
||||||
|
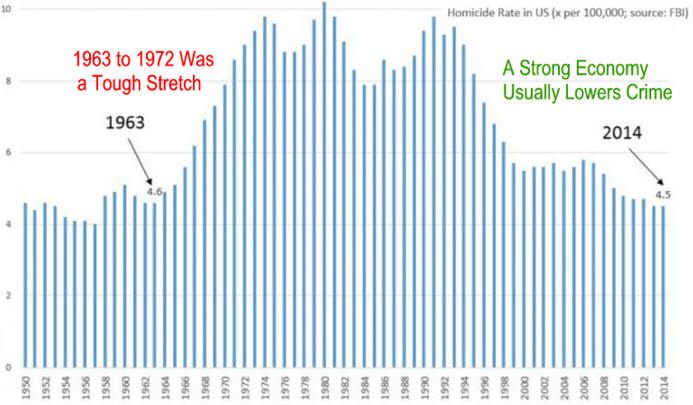
Homicide Rate
Down from 10% in 1980 to 4.5% in 2014.
|
||||||
|
|
||||||
|
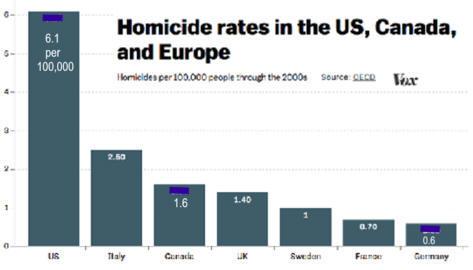
But We Still Have a Homicide Problem
|
||||||
|
Convictions Rate is Low
|
||||||
|
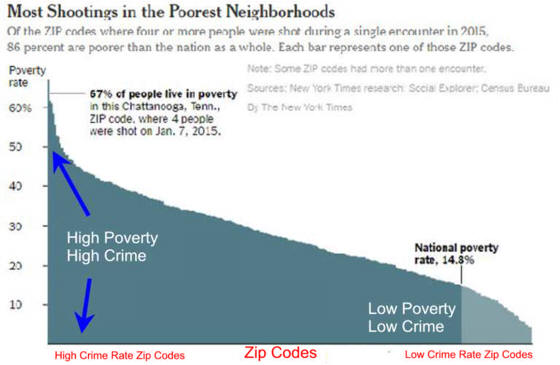
Poverty is Part of the Problem
|
||||||
|
|
||||||
|
|
||||||
|
Many Mental Health and
|
||||||
|
|
||||||
|
|
||||||
|
|
||||||

| Total Prison Population and Drug-Law Offenders in Prison | ||||
|---|---|---|---|---|
| 2003-07 | 2008 | 2009 | 2010 | |
Prison Population in Europe (27)* 1,2
|
596,956 | 623,230 | 641,845 | 627,203 |
| Prison Population Rate in Europe | 0.12% | 0.13% | 0.13% | 0.13% |
| Highest Prison Population Rates | ||||
| Lithuania | 0.25% | 0.23% | 0.25% | 0.27% |
| Latvia | 0.33% | 0.29% | 0.31% | 0.30% |
| Estonia | 0.34% | 0.27% | 0.27% | 0.26% |
| Lowest Prison Population Rates | ||||
| Denmark | 0.07% | 0.06% | 0.07% | 0.07% |
| Slovenia | 0.06% | 0.07% | 0.07% | 0.07% |
| Finland | 0.07% | 0.07% | 0.07% | 0.06% |
| Proportion of Sentenced Prisoners Among Total Prisoners In Europe1,3 | 73.8% | 74.4% | 75.3% | 77.7% |
| Highest Proportions of Sentenced Prisoners | ||||
| Czech Republic | 84.9% | 88.3% | 89.2% | 88.8% |
| Poland | 80.0% | 88.4% | 88.2% | 89.0% |
| Romania | 84.8% | 89.1% | 85.4% | 82.9% |
| Lowest Proportions of Sentenced Prisoners | ||||
| Malta | 50.4% | 30.7% | 36.0% | 30.5% |
| Netherlands | 37.3% | 35.4% | 36.5% | 49.6% |
| Italy | 56.8% | 43.6% | 49.3% | 54.2% |
| Proportion of Sentenced Drug-Law Offenders Among Total Sentenced Prisoners in Europe | 17.6% | 17.6% | 17.6% | 18.5% |
| Highest Proportion of Drug-Law Offenders | ||||
| Malta | 32.5% | - | 53.4% | - |
| Greece | 50.6% | - | - | 52.3% |
| Italy | 33.5% | 36.1% | 36.9% | 38.4% |
| Luxembourg | 31.9% | 44.6% | 38.7% | 36.1% |
| Lowest Proportion of Drug-Law Offenders | ||||
| Lithuania | 4.6% | 6.5% | 8.4% | 1.0% |
| Hungary | 1.9% | 2.5% | 2.6% | 3.1% |
| Romania | 2.5% | 4.0% | 4.2% | 4.3% |
| Proportion of Sentenced Drug-Law Offenders Among Total Prisoners in Europe4 (Sentenced and Pre-Trial) | 12.5% | 12.1% | 12.5% | 13.9% |
| Highest Proportions of Drug-Law Offenders | ||||
| Greece | 37.3% | - | - | 36.0% |
| Luxembourg | 19.8% | 26.4% | 21.9% | 20.7% |
| Sweden | 18.4% | 24.1% | 22.9% | 22.1% |
| Lowest Proportions of Drug-Offenders | ||||
| Hungary | 1.4% | 1.7% | 1.8% | 2.1% |
| Romania | 1.9% | 3.6% | 3.6% | 3.6% |
| Slovakia | 2.3% | - | 5.1% | 4.6% |
Notes:
(1) Total number of prisoners (pre-trial and sentenced prisoners) on 1
September.
(2) In 2010, data for Belgium and England and Wales concern 2009.
(3) In 2010, data for Austria, Belgium and England and Wales concern 2009.
Data missing for other years have been interpolated from adjacent years.
(4) ‘Europe’ refers to the weighted average for EU-27 (excluding Austria
and Poland).
(5) The proportion of sentenced drug-law offenders among the total
sentenced prisoners on 1 September.
*27 is from EU-27, according to the European Commission's Eurostat this
simply refers to the 27-member EU.
http://epp.eurostat.ec.europa.eu/statistics_explained/index.php/Glossary...