|
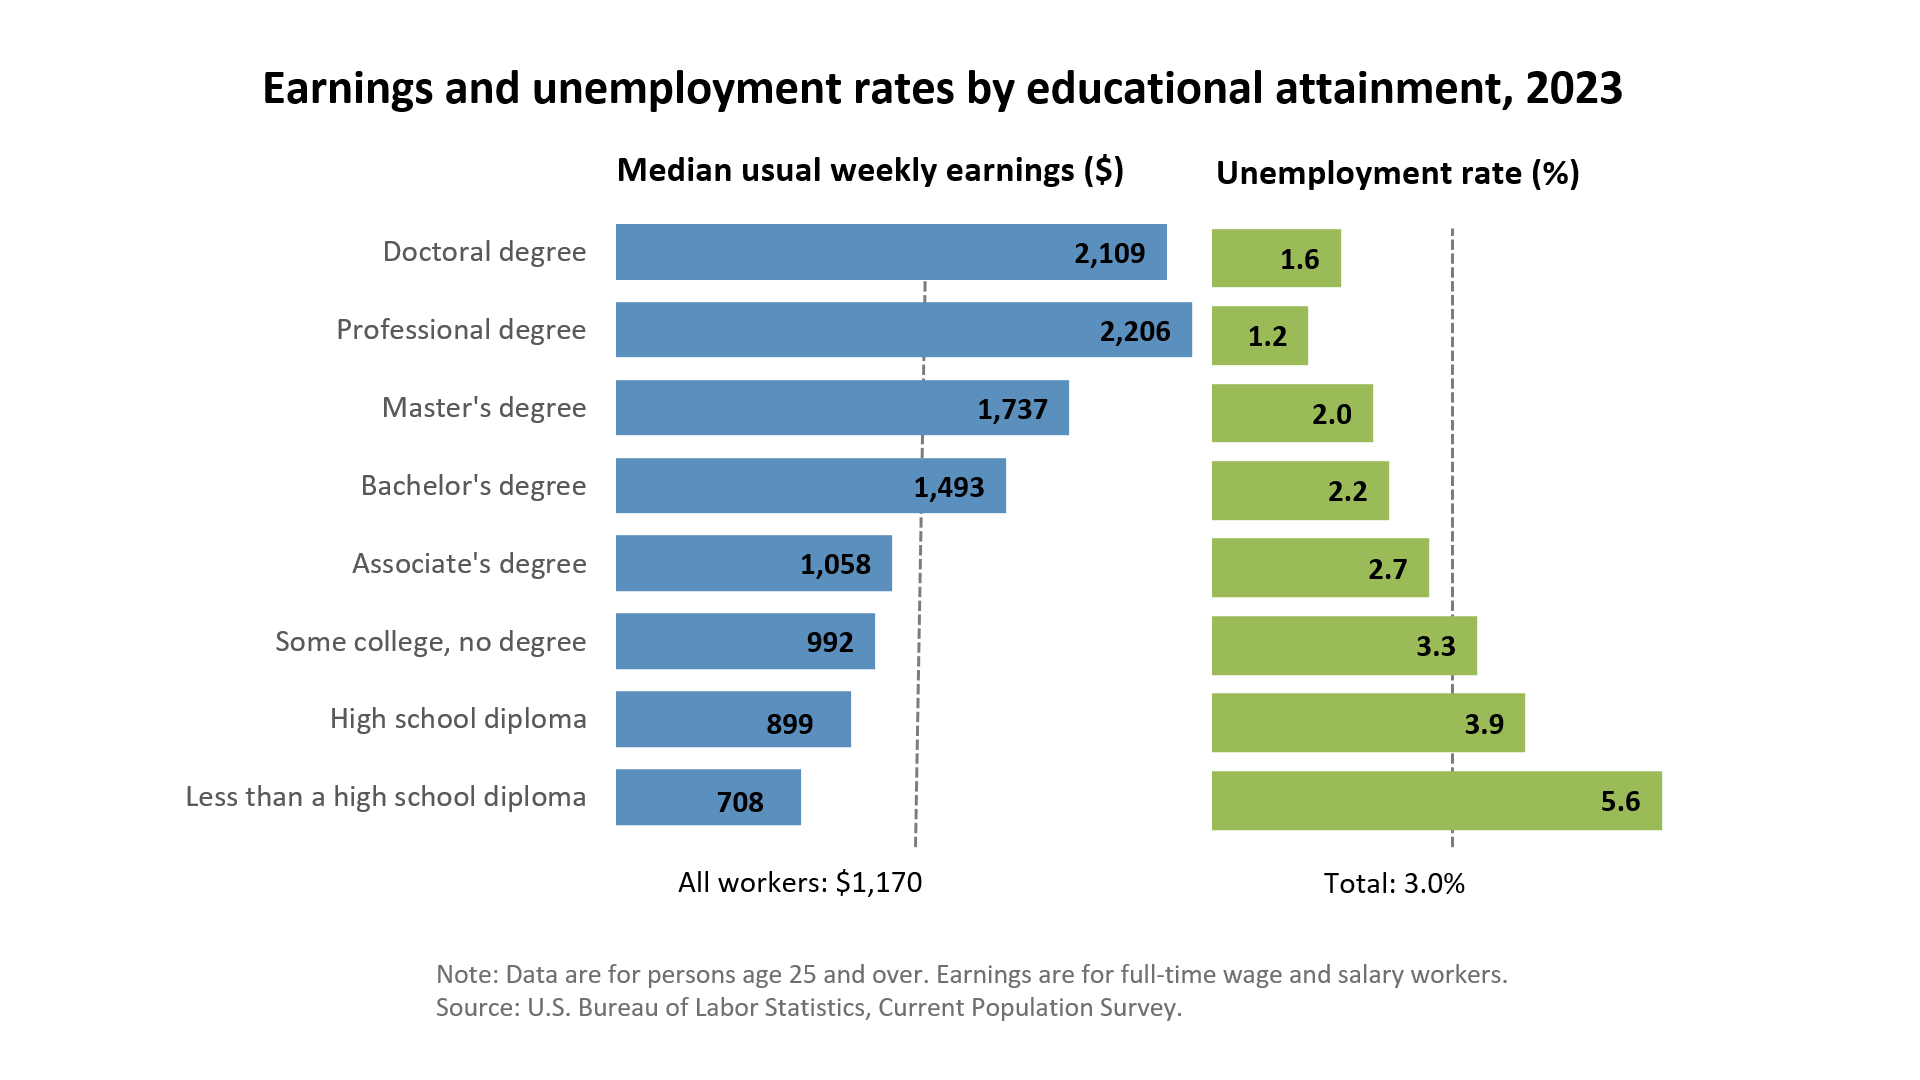
1) More Education and Work Experience
Means More Income

edited by
Walter Antoniotti
2) What You Study Determines
Earnings
Top AA Earners Earn More Than Bottom Half of Bachelors
from
payscale.com/ More Data bachelor's
data by Major
|
Percentile |
Associate's
Starting
Pay |
Bachelor's
Starting Pay |
Job Type |
Bachelor's Premium |
With 10 Years
Experience |
|
10th |
$21,000
|
$25,400 |
Admin.Assist. |
10% |
4% |
|
25th |
$26,700
|
$32,900 |
Dental Hygienist |
9% |
5% |
|
50th |
$35,100
|
$43,200 |
Registered Nurse |
4% |
6% |
|
75th |
$46,700
|
$56,900 |
Construction Manager |
17% |
19% |
|
90th |
$61,600
|
$73,800 |
Inside Sales Rep. |
15% |
24% |
|
"Starting median pay for those who hold only a
bachelor's degree is $43,200, which is over 20 percent higher than
the national starting median pay for those who hold an associate's
degree ($35,100). However, those extra two years are expensive.
Assuming you don't work at the median associate's degree pay of
$35,100 for two years, and pay ~$8,000 a year for tuition and fees,
that is a $88,200 in foregone income and expenses. In general, getting a bachelor's degree is a win in
terms of pay over an associate's degree. In our sample,
the national starting median pay for those who hold only a
bachelor's degree is $43,200, which is over 20
percent higher." Editor's Note:
Only 26%
of 2015 jobs required a bachelor's degree or higher but the highest
pay jobs of those not requiring a degree generally go to college
graduates.
"Nationwide, 22 percent of college students with annual family
incomes over $100,000 attended community colleges last year, up from
16 percent four years ago, according to a study by
Sallie Mae"
Please
25% of Students from Households Earning $100,000 or more
Debt Causes Significant Number of Millennials Regret Going to College
Federal Rules Make It Easier for Student Loans Forgiveness
Bankers Ease Rules on Automatic Student Loan Defaults |

3)
Advanced Degrees Not Always Financially Successful
1st Quarter of 2016
Average Wages for Select Percentiles |
| |
Number |
1st decile |
1st quartile |
median |
3rd
quartile |
9th decile |
|
Weekly |
15,379 |
$695 |
$982 |
$1,435 |
$2,110 |
$3,120 |
|
Yearly |
= |
$36,140 |
$51,064 |
$74,620 |
$109,702 |
$162,240 |
|
NOTE: Ten
percent of all full-time wage and salary workers earn
less than the upper limit of the first decile; 25
percent earn less than the upper limit of the first
quartile; 50 percent earn less than the upper limit of
the second quartile, or median; 75 percent earn less
than the upper limit of the third quartile; and 90
percent earn less than the upper limit of the ninth
decile. Estimates for the above race groups (White,
Black or African American, and Asian) do not sum to
totals because data are not presented for all races.
Persons whose ethnicity is identified as Hispanic or
Latino may be of any race. Updated population controls
are introduced annually with the release of January
data.
bls.gov. Editor's note: The variability within
cohort centers on field of study with higher earners
having a
professional degrees, a STEM degree, or a
PhD. |
|
4) Who Earns More With Just a
Bachelors Degree?
Having a high school degree
provides Higher earnings boost for almost everyone.
For the
�high-ability� group, a bachelor�s degree provides a
moderate boost to wages�certainly lower than what we think of as
the benefits of college, but still a respectable amount that makes
getting the degree worthwhile." Some in this group have the
characteristics necessary for an advanced degree where the earnings
may substantially increase.. But for the �low-ability� group, the bachelor�s degree
earnings premium is nonexistent."
Source See
America's Most Overrated Product-Higher Education |
5) Available Jobs
|
Typical entry-level
education |
Need Rank |
2014 Employment |
Expected Job Created
2014-2024 mil |
|
in
millions |
Percent |
|
High school
diploma or equivalent |
1 |
55 |
36 |
20 |
|
No formal
educational credential |
2 |
41 |
27 |
11 |
|
Bachelor's
only degree |
3 |
32 |
21 |
7 |
|
Postsecondary
no degree award |
4 |
9 |
6 |
5 |
|
Doctoral or
professional degree
|
5 |
4 |
2 |
few |
|
Master's
degree |
6 |
2 |
2 |
few |
|
Some college,
no degree |
7 |
4 |
4 |
few |
|
Associate's
degree |
8 |
3 |
2 |
few |
|
Total, all
occupations |
NA |
151 |
100.0 |
NA |
|
"...we find no evidence of improved earnings
post-enrollment for students in any of the top ten for-profit fields..."
National Bureau of Economic Research
Most for-profit
schools and many small liberal arts colleges are not selective. Look
at test scores and percent accepted to determine selectivity.
See
Employment Data on College Majors Business Insider 2014 |
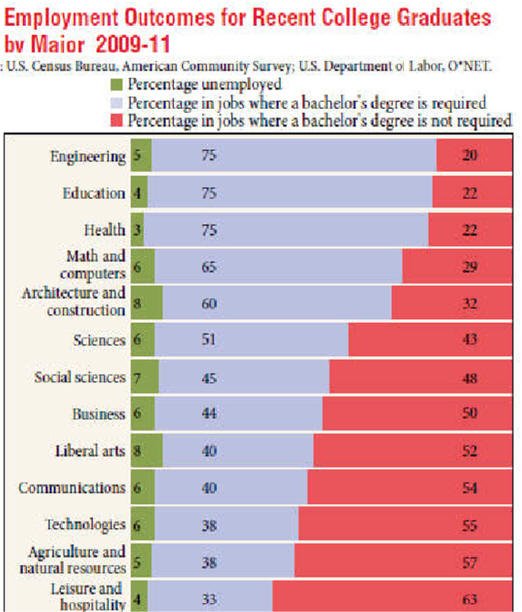
7) Recent Employment by
Major

8) Some Took a Path Less traveled.
|
Many years ago my fourteen
year-old nephews
was not interested in academics and wanted to attend a neighboring high
school with a carpentry program. It would be a new, strange
school. At fourteen! Four years of getting up early and getting a ride from his
father to grandmother's house where he waited for the school bus. After school he walked
home from grandma's. No one told him from what to do; he just didn't
like academics and decided on a vocational education. Now a successful
small contractor, his biggest problem is convincing his wife they
don't
need a new Volvo every two years. With state testing this would be much
more difficult.
More Interesting Thoughts Concerning Education
|
see
3 Free Career Building Books
9) Long-term
Graduate Underemployment Problem

Source
11)
Income
by Degree

12) Income by Major
The table below shows the average starting salaries according to
Payscale's 2015-2016 College Salary Report:
| Academic Major |
Salary with a Bachelor's Degree
|
Salary with a Master's Degree |
|
Biology
|
$40,400 |
$50,200 |
|
Business Administration
|
$45,800 |
$55,600 |
|
Computer Science
|
$63,100 |
$81,200 |
|
Elementary Teacher Education
|
$34,300 |
$39,700 |
|
History
|
$41,100 |
$44,900 |
|
Mathematics
|
$52,400 |
$63,100 |
|
Mechanical Engineering
|
$62,500 |
$71,600 |
|
Nursing
|
$56,600 |
$82,000 |
|
Political Science
|
$43,300 |
$50,300 |
|
Psychology
|
$37,600 |
$45,200 |
Show me 10 popular schools
|